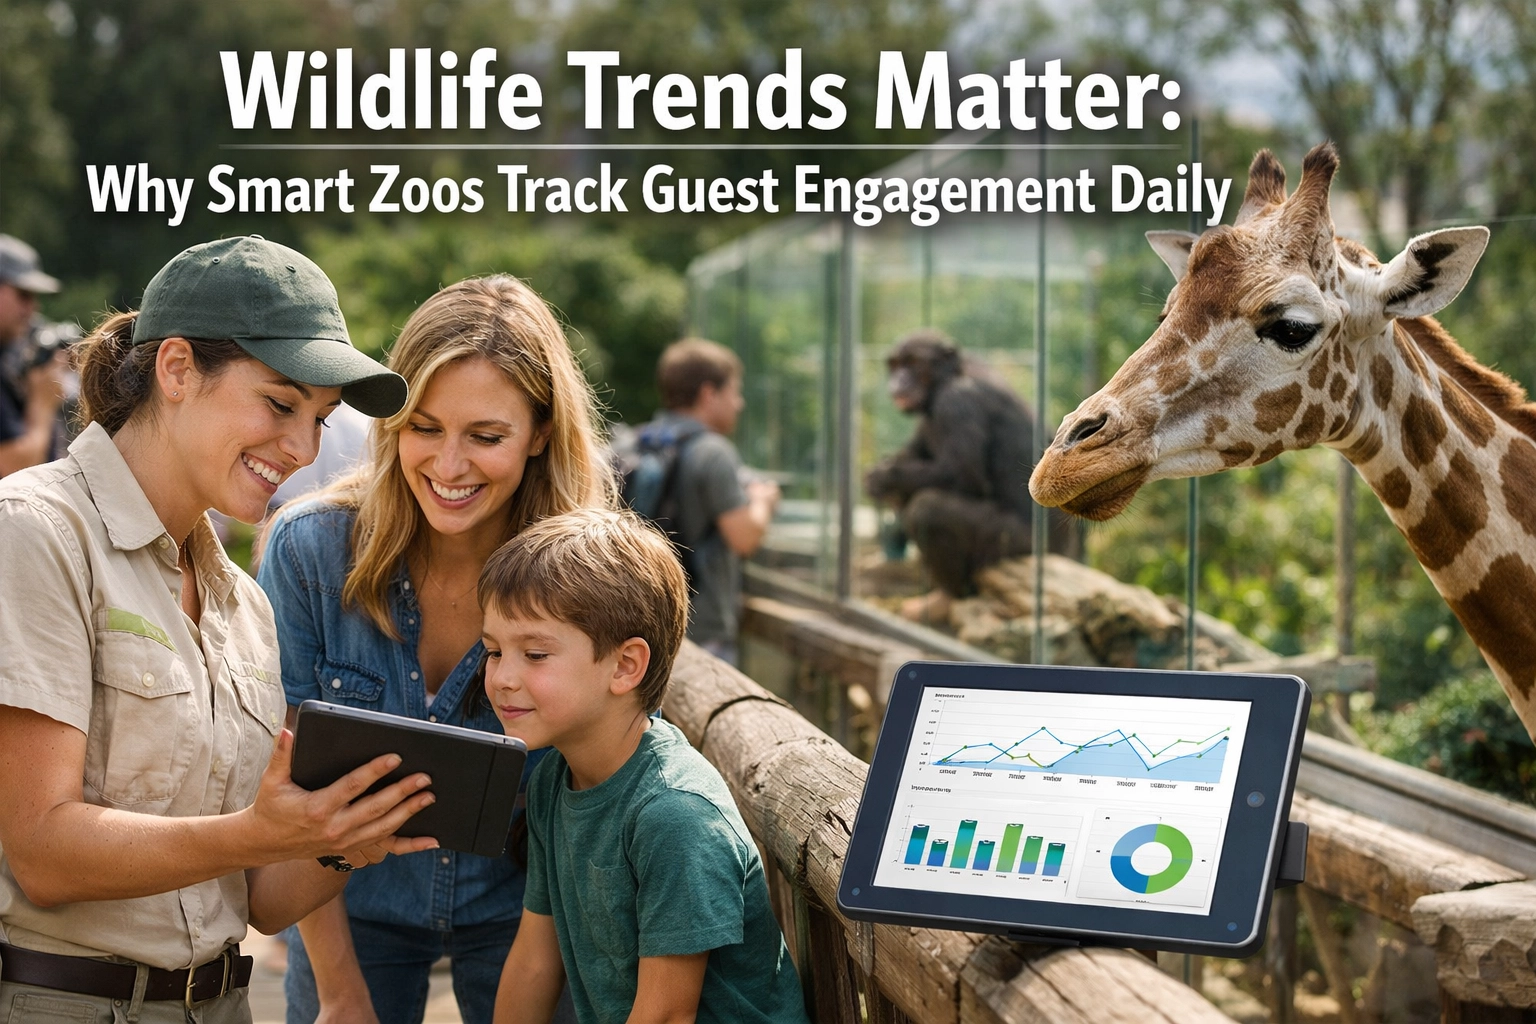
Wildlife Trends Matter: Why Smart Zoos Track Guest Engagement Daily
Most zoos track ticket sales. Smart zoos track what happens after the ticket scan.
Guest engagement data tells you which exhibits work, which conservation messages land, and where visitors actually stop versus walk past. It's the difference between guessing and knowing.
Here's what daily tracking looks like in practice.
What Gets Measured
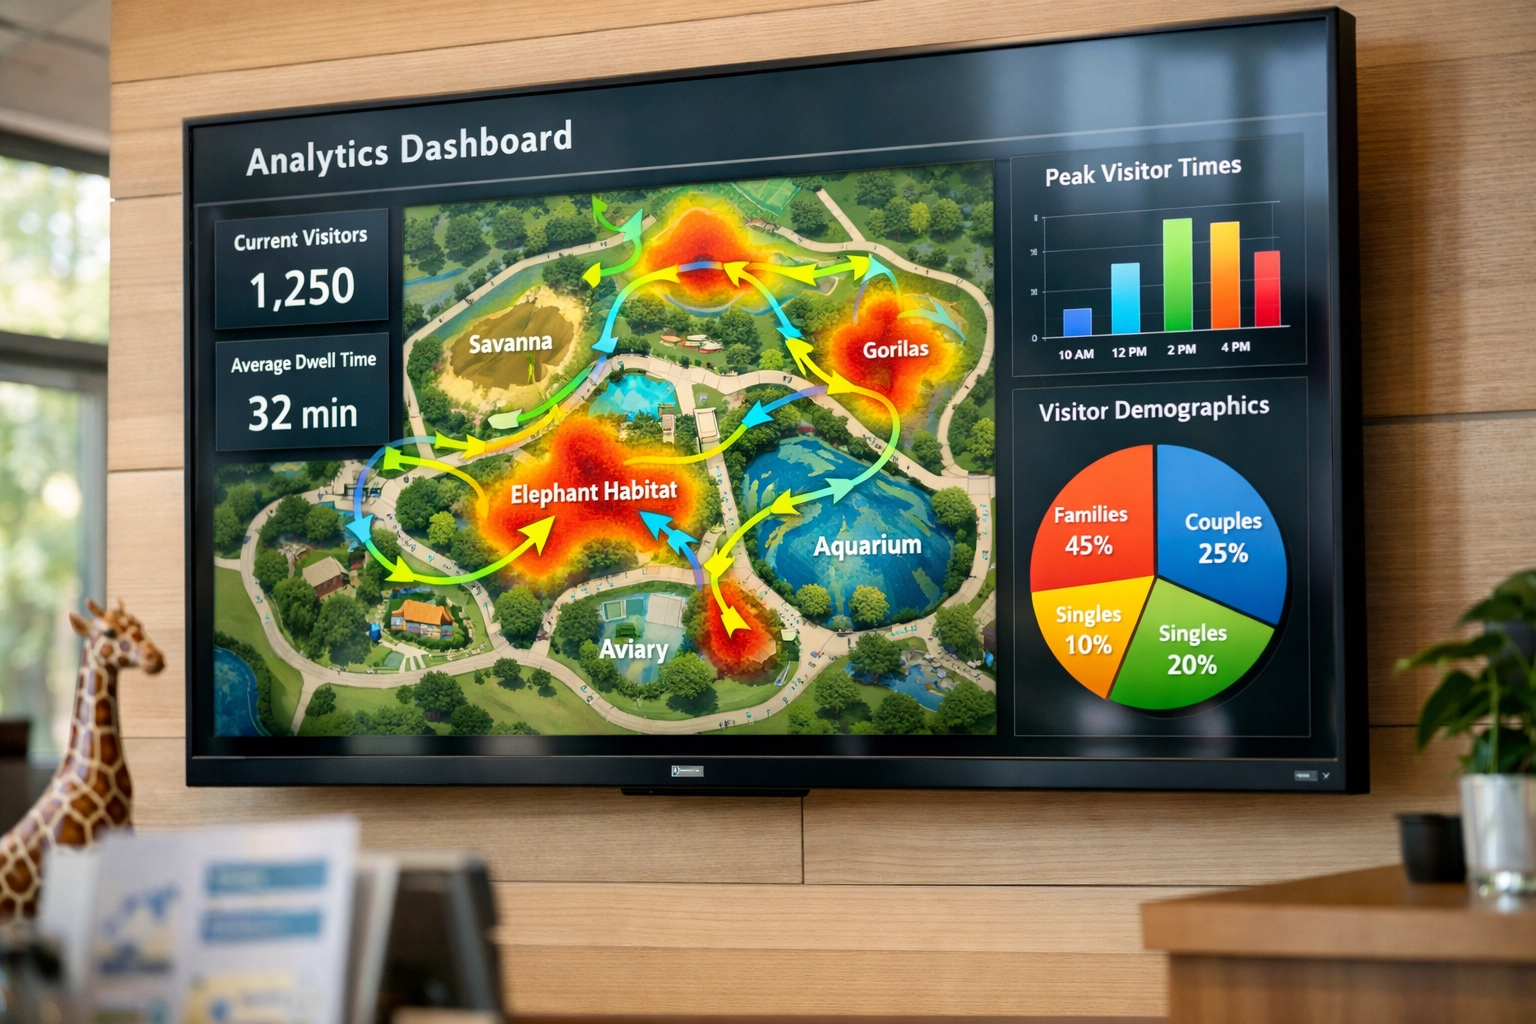
Dwell time. That's the big one.
How long someone stands at an exhibit matters more than how many people walk by it. A cheetah enclosure with 1,000 daily visitors but 30-second average stops isn't performing. A penguin habitat with 400 visitors and 8-minute stops? That's engagement.
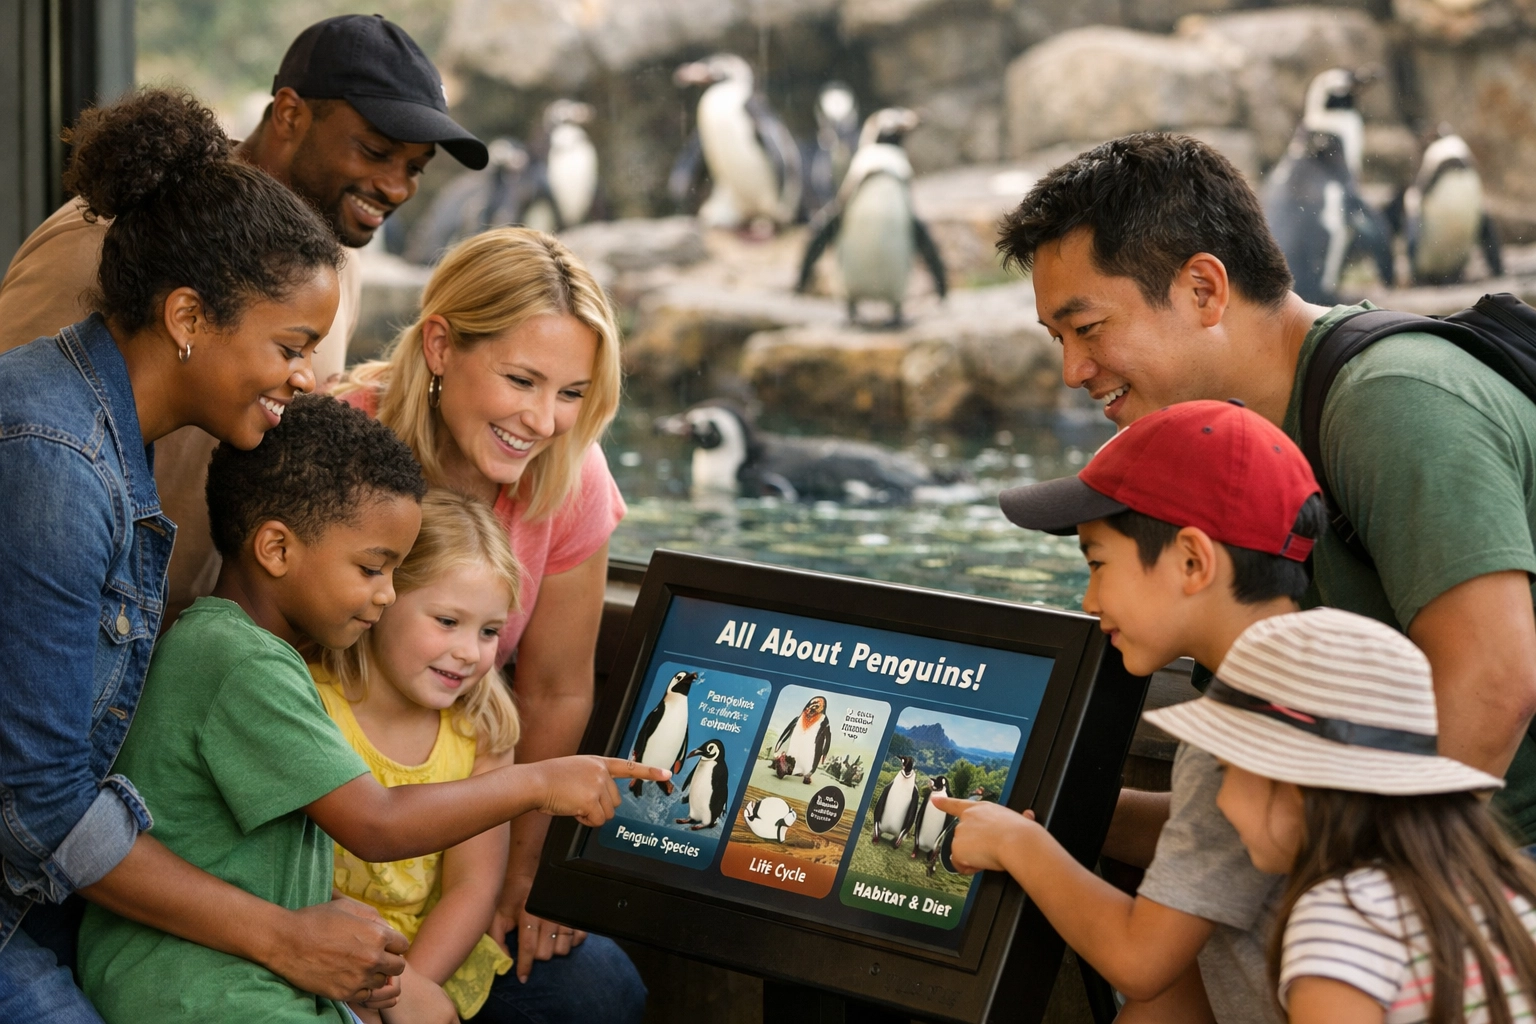
Smart tracking systems monitor:
- Time spent at each exhibit
- Interactive element usage (touchscreens, QR codes, educational displays)
- Staff demonstration attendance
- Educational film completion rates
- Conservation signage interaction
- Photo-taking patterns
- Return visitor behavior
Think of it as analytics for physical spaces. Same principles as website tracking, different environment.
The Conservation Connection
Engagement drives conservation outcomes.
Visitors who interact with educational materials, watch demonstrations, or talk with staff show measurably higher biodiversity knowledge. More importantly, they report stronger intentions to take conservation action after their visit.
That's the point, right? Not just attendance. Actual impact.
Daily tracking reveals which conservation messages resonate. Maybe your plastic pollution exhibit gets 3-minute stops while your local species recovery story gets 7 minutes. That's valuable intelligence.
You can adjust messaging, update displays, and redirect resources based on what actually captures attention versus what you hope will capture attention.
The data shows clear patterns:
Visitors who engage with staff demonstrations stay 50% longer. Those who interact with educational films stay 89% longer. Those numbers translate directly to conservation education effectiveness.
Track daily. Adjust weekly. Improve monthly.
Operational Intelligence
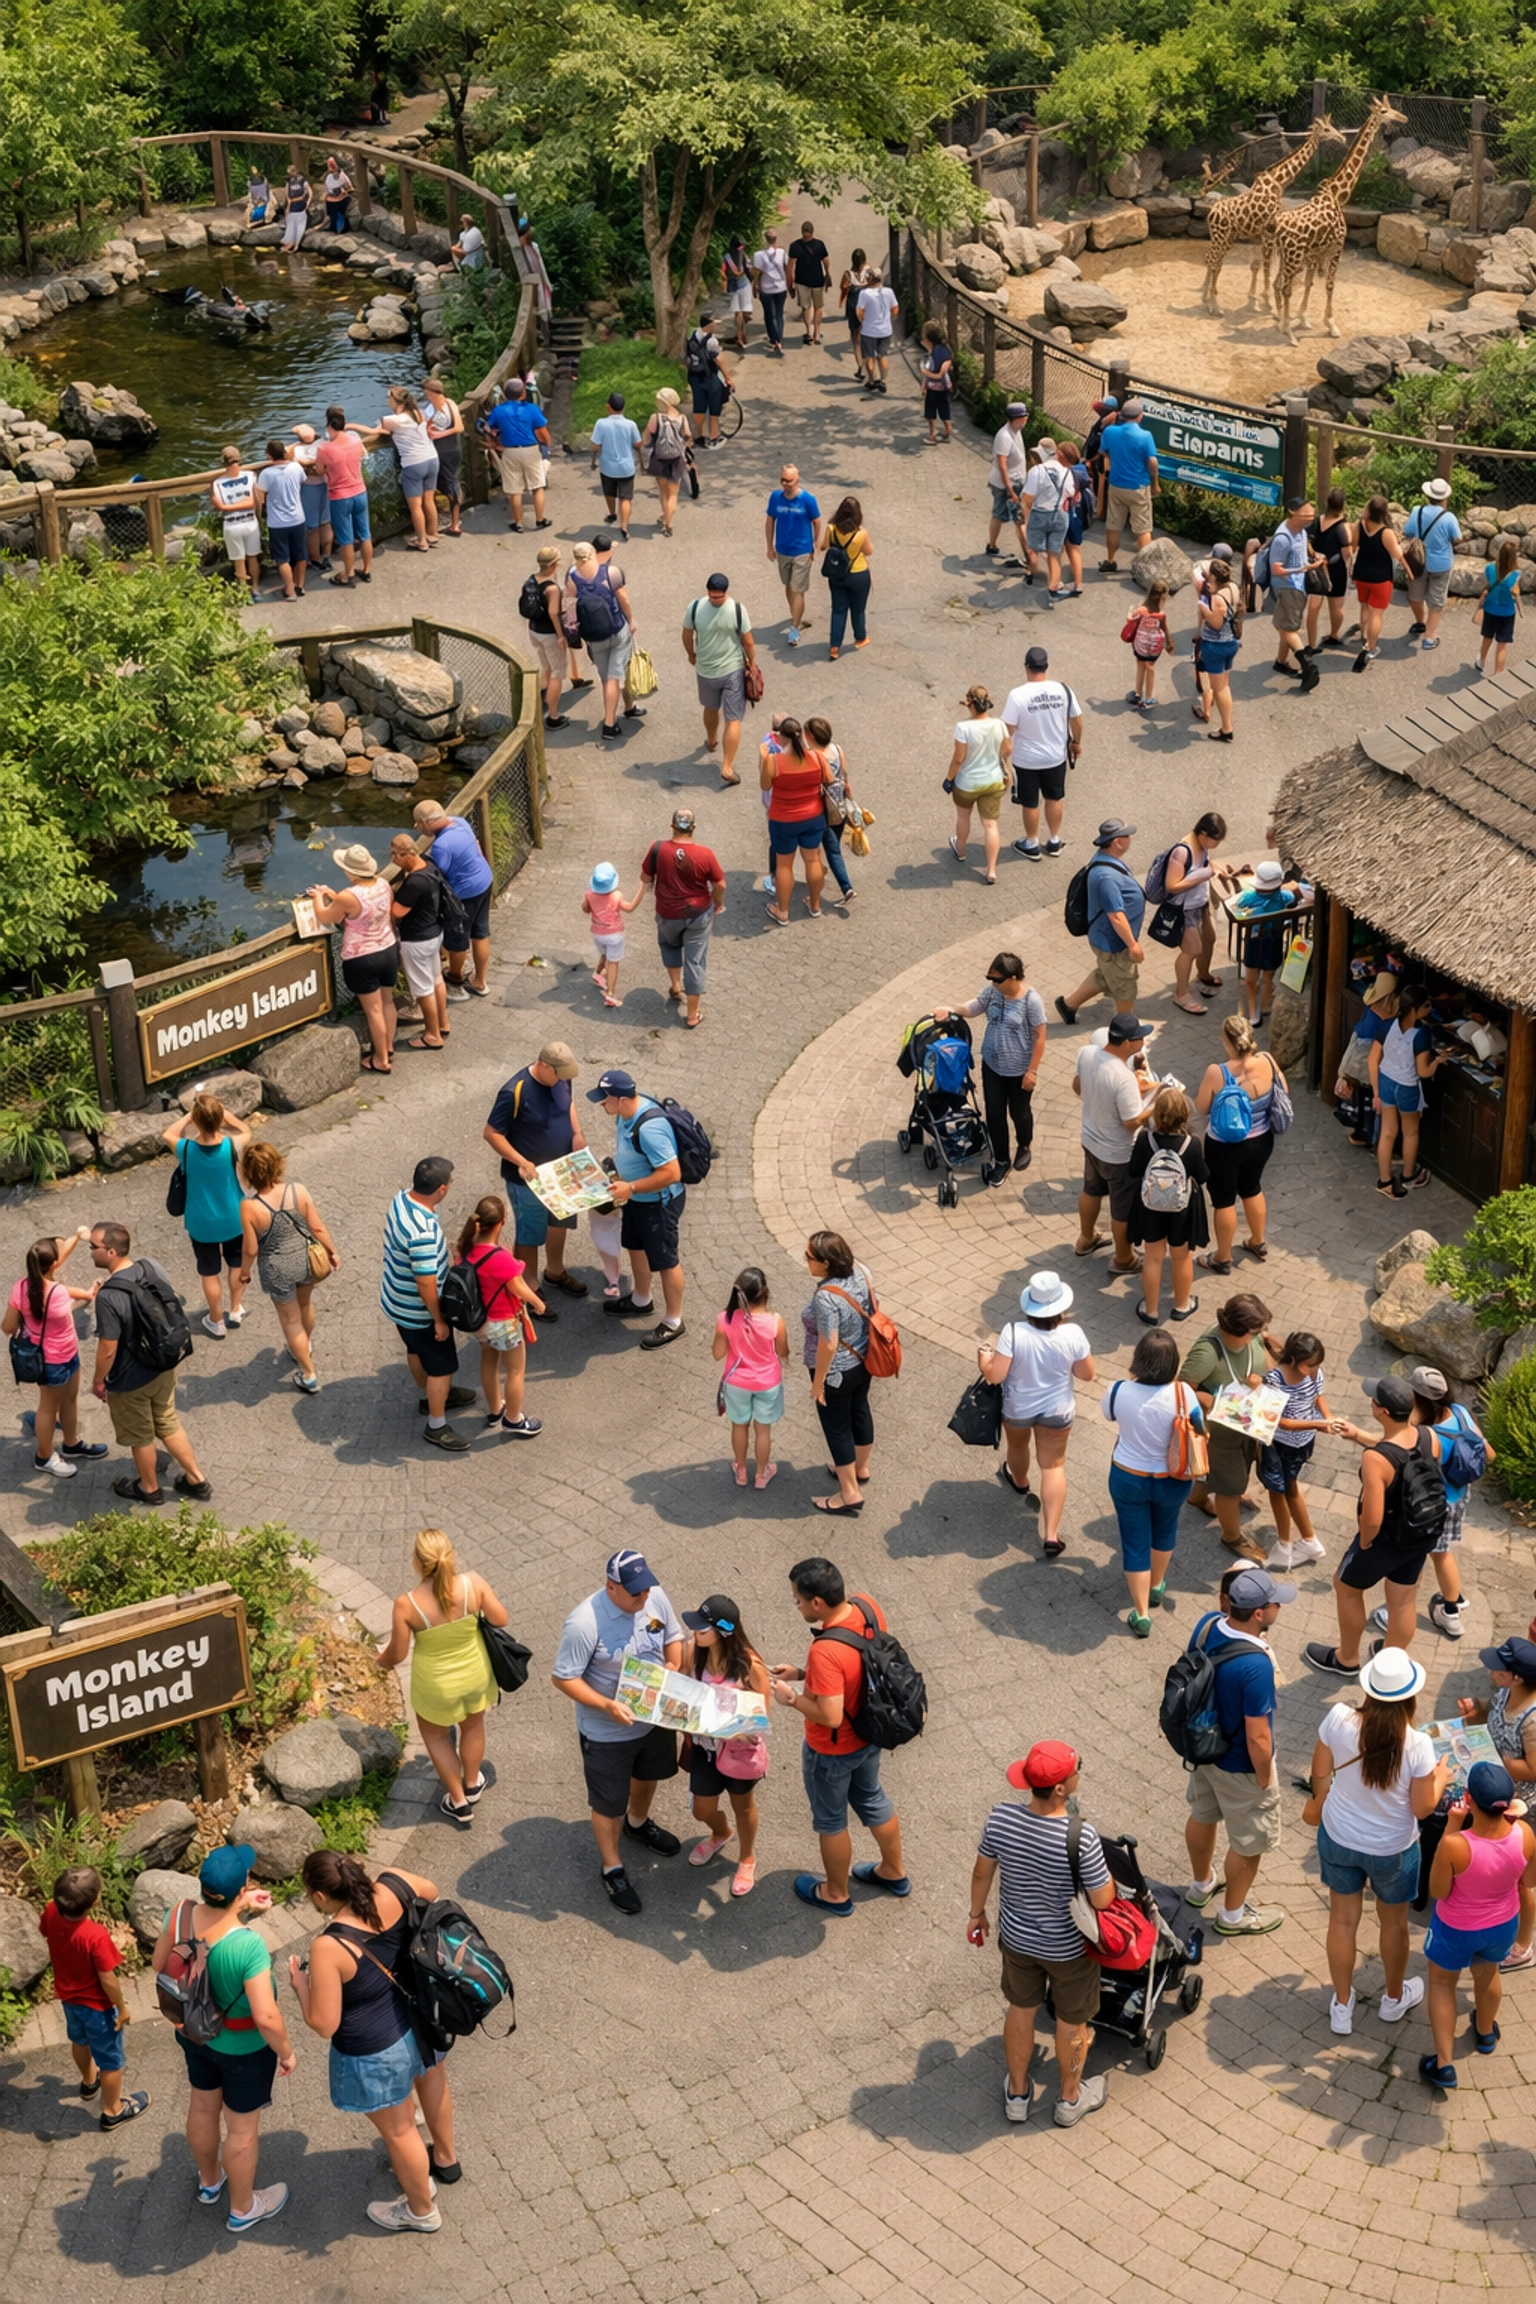
Guest flow patterns tell you where bottlenecks form.
Real-time monitoring shows when certain exhibits hit capacity, which pathways see the most traffic, and where people lose interest. You can reroute staff, add temporary signage, or adjust feeding demonstration times.
Overcrowding hurts everyone. Stressed visitors don't learn. Stressed animals don't behave naturally. Daily tracking helps you spread guest traffic throughout the day and across the facility.
Some zoos use this data to adjust entry times, create timed-entry windows for popular exhibits, or deploy roaming educators to underutilized areas. Small operational changes, significant experience improvements.
One aquarium found that their touch tank had a 4:00 PM bottleneck every single day. They added a second staff member during that window. Average wait time dropped from 22 minutes to 6 minutes. Guest satisfaction scores jumped.
That's what daily data reveals. The patterns you can't see by walking around.
Building Relationships Beyond The Visit
Smart engagement platforms track what each visitor interacted with during their visit.
Then they personalize follow-up communications.
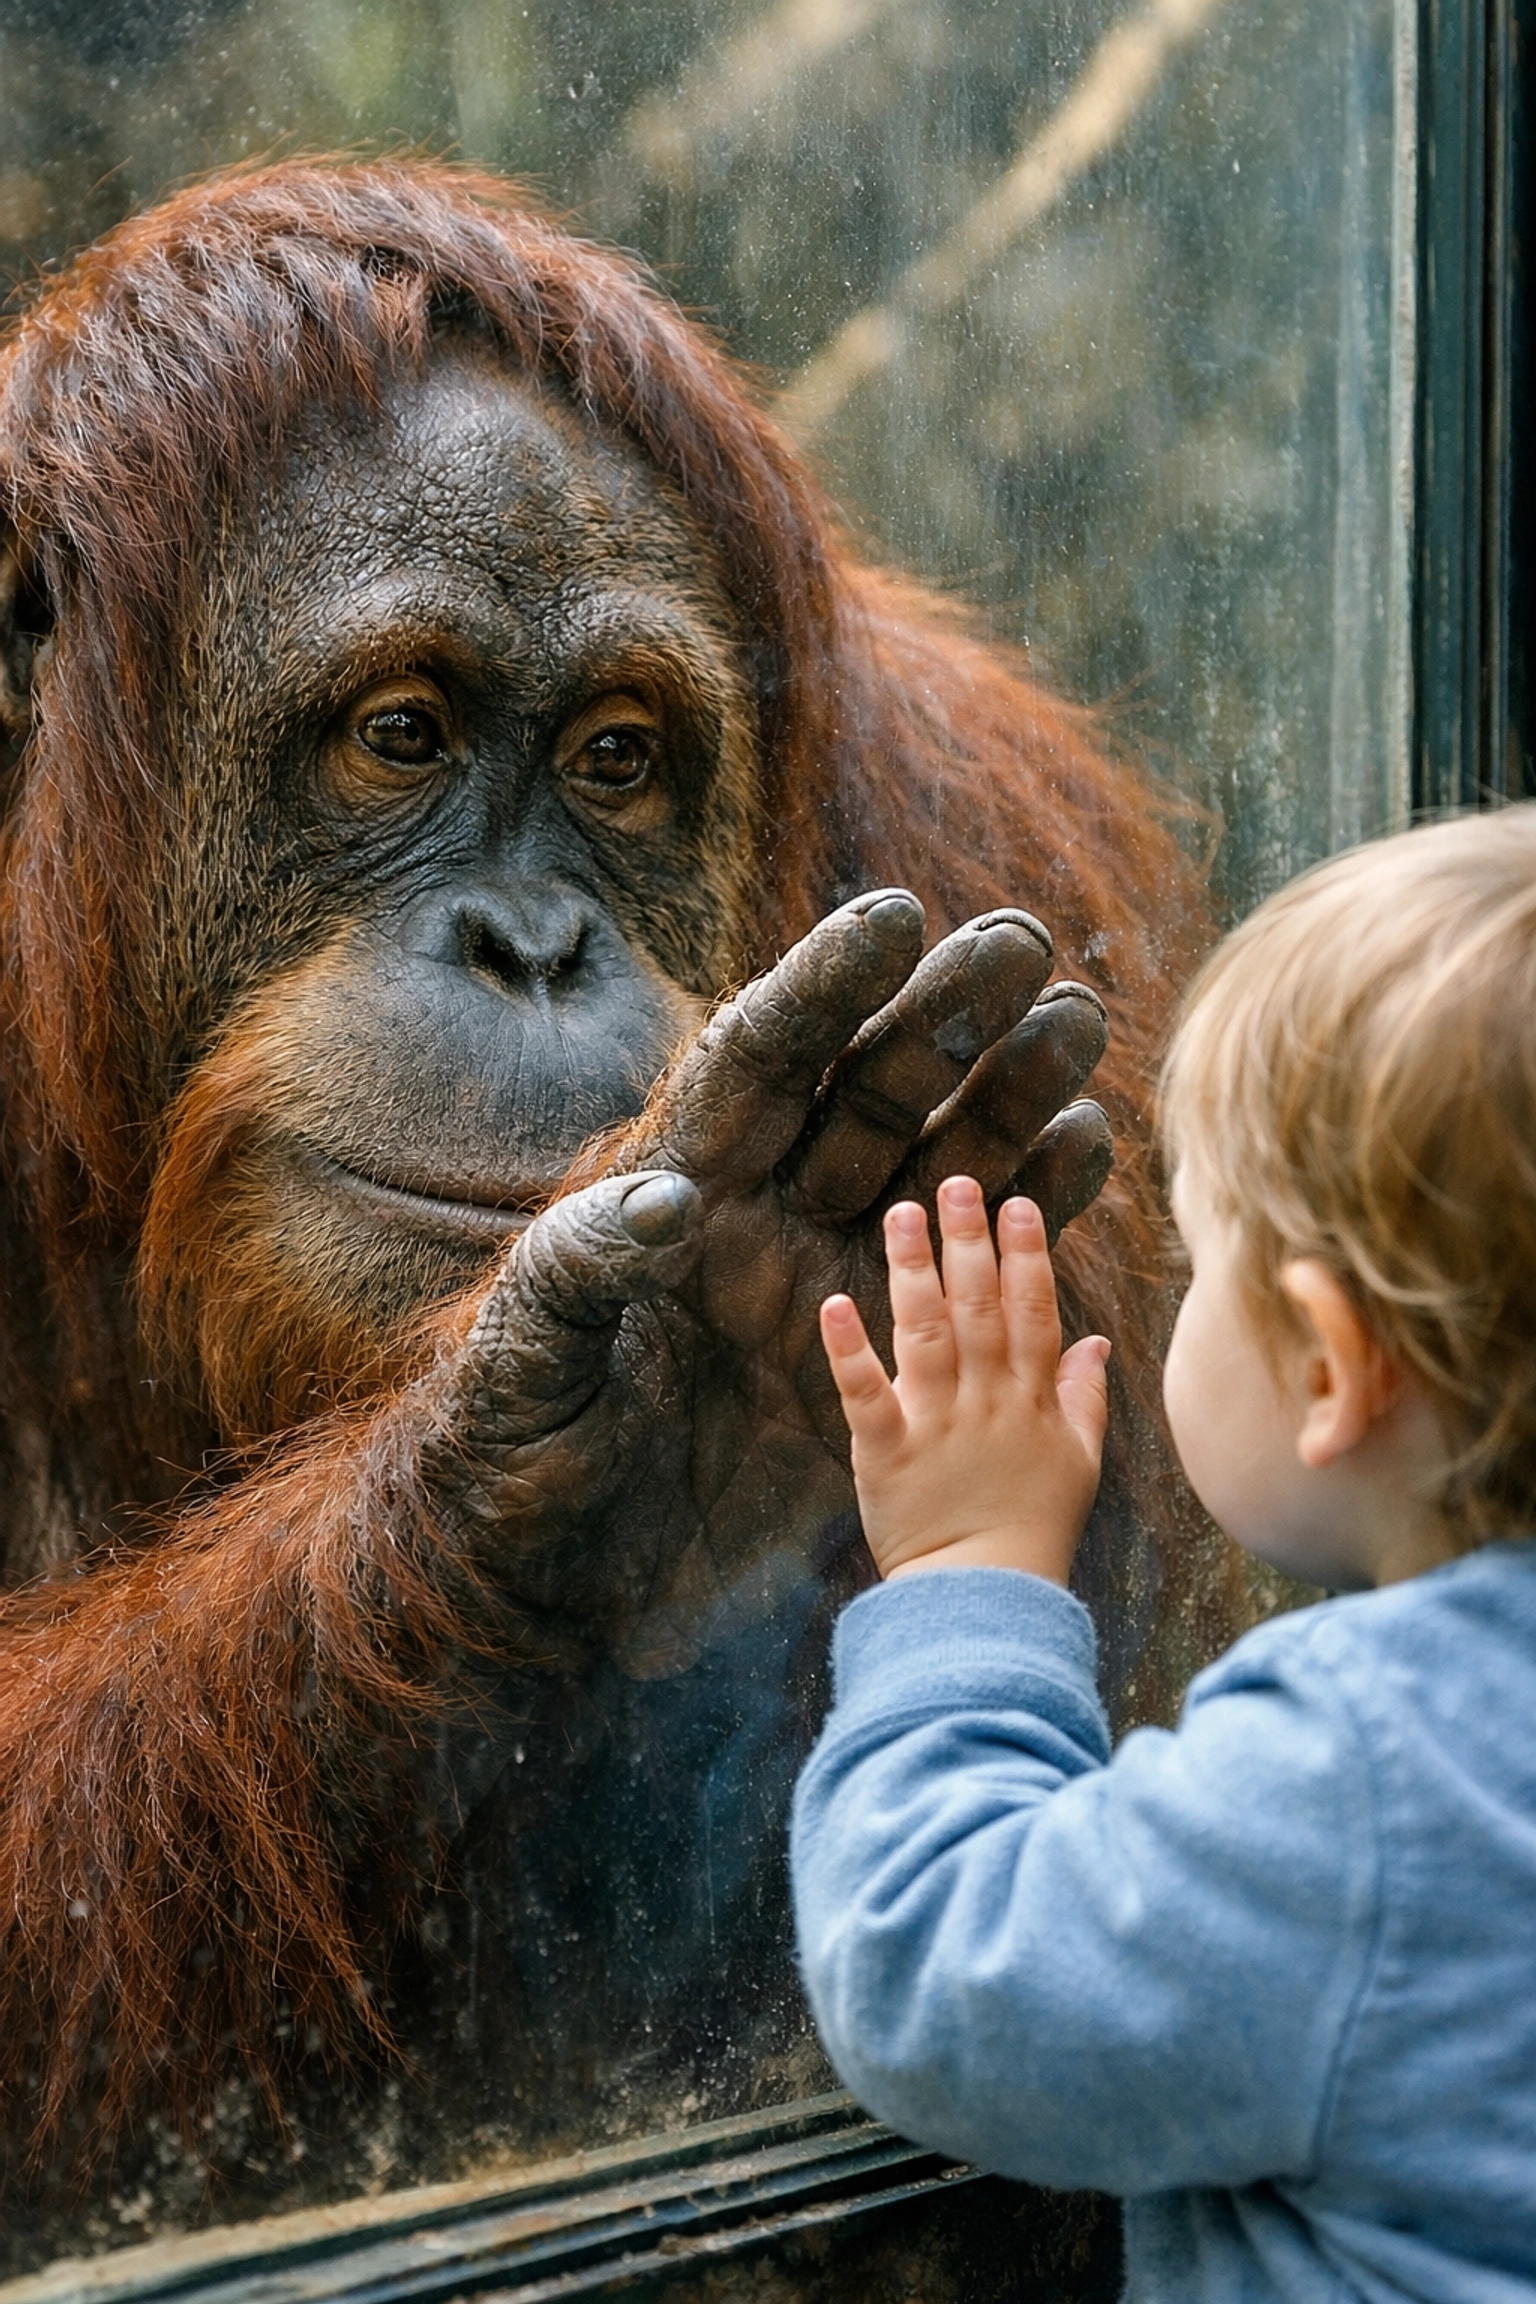
Someone who spent 12 minutes at your orangutan exhibit? Send them updates about that specific conservation program. Family that attended the sea turtle rehabilitation demonstration? Share recovery milestones for the animals they saw.
Generic post-visit emails get ignored. Relevant, personalized updates get opened.
This approach drives:
- Membership renewals
- Repeat visits
- Conservation program donations
- Social media engagement
- Word-of-mouth recommendations
You're not spamming everyone with the same message. You're continuing conversations based on demonstrated interest.
Daily tracking makes this possible. Without it, you're sending the same newsletter to someone who spent 90% of their visit in the reptile house and someone who never left the savanna exhibits.
Animal Welfare Considerations
Guest engagement tracking also protects animal welfare.
High-traffic exhibits need monitoring to ensure animals aren't experiencing stress from constant crowds. Daily data shows which animals face the most visitor pressure and when.
Some facilities use this information to:
- Create quiet hours for sensitive species
- Rotate animals between public and private spaces
- Adjust habitat design to provide retreat areas
- Schedule enrichment activities during low-traffic periods
Better for animals. Better for guests who see more natural behaviors instead of stressed pacing.
One zoo noticed their tiger exhibit had overwhelming crowds during midday. They moved their big cat talk to 10:00 AM, distributed the crowd earlier, and gave the animals calmer afternoons. Engagement quality improved even though total visitor numbers stayed the same.
The Daily Rhythm
Daily tracking creates a feedback loop.
Check yesterday's data each morning. Identify patterns. Make adjustments. Repeat.
Weekly trends emerge. Monthly insights develop. Annual strategies take shape.
Without daily data, you're making decisions based on assumptions, occasional observations, and hope. With it, you're making decisions based on actual guest behavior.
Most visitor management platforms now include:
- Real-time dashboards
- Automated daily reports
- Comparative analysis tools
- Alert systems for unusual patterns
- Integration with photo/video content systems
The technology exists. Implementation is straightforward. The question is whether your facility prioritizes this intelligence.
Why This Matters For Marketing
Guest engagement data directly improves your marketing content.
Photos and videos from high-engagement exhibits perform better in campaigns. You know which animals your audience connects with most. You understand which conservation stories generate the strongest emotional response.
That intelligence shapes:
- Social media content calendars
- Email campaign themes
- Sponsored content topics
- Partnership opportunities
- Educational program development

When you know your penguin exhibit averages 9-minute stops while your flamingo habitat averages 2 minutes, you allocate photo shoot resources accordingly. You build marketing campaigns around proven engagement rather than guesswork.
Your visual content library should reflect what actually resonates with visitors, not just what looks impressive.
Getting Started
You don't need complex systems on day one.
Start simple:
- Manual observation tracking at key exhibits
- Staff logs of demonstration attendance
- Basic timing of average guest stops
- Simple surveys at exit points
Then build from there as patterns emerge and budget allows.
The goal isn't perfect data. It's better decisions based on actual behavior instead of assumptions.
Smart zoos track engagement daily because it improves conservation outcomes, guest experiences, and operational efficiency.
Want to see how visual content supports these engagement strategies? Browse real animal photography from facilities tracking what works: zooimagery.com
Connect with us on LinkedIn for weekly insights on wildlife marketing and conservation storytelling.

